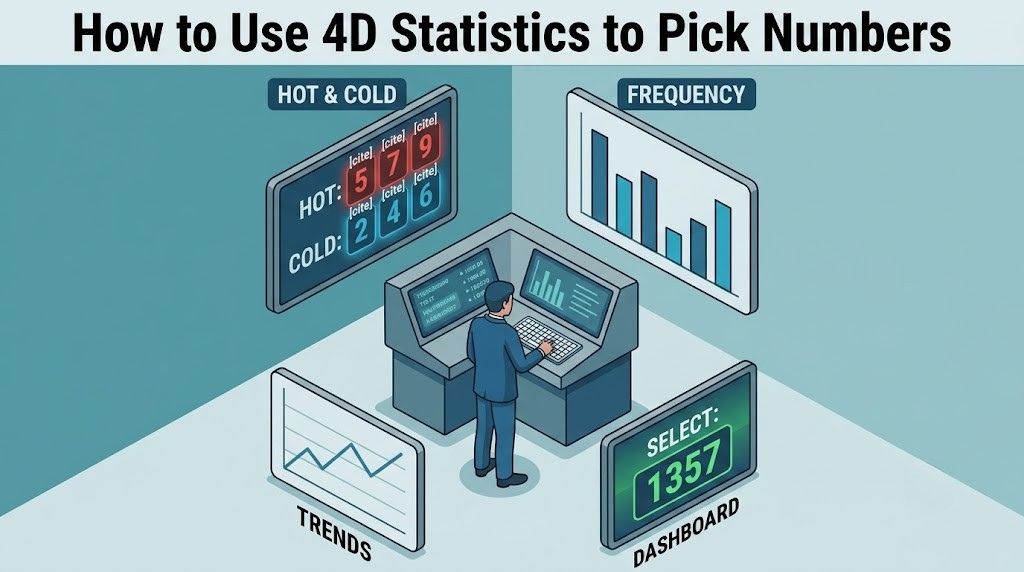
Knowing that 4D statistics exist is one thing — knowing how to apply them to actual number selection is another. Many players glance at frequency tables without a clear process for turning that data into a shortlist of numbers to bet on. This guide gives you a practical step-by-step approach to using 4D statistics to pick numbers, covering how to set your parameters, which data points to prioritise and how to combine statistical signals with your own instincts.
This is a strategy guide, not a prediction system. 4D draws are random events and no statistical method guarantees a win. What statistics do is help you make more structured, consistent decisions rather than picking numbers at random every draw.
Step 1 — Choose Your Time Window First
Before you look at any frequency data, decide how many past draws you want to analyse. This is the single most important parameter because it determines what your hot, cold and overdue labels actually mean.
A short window (last 20–50 draws) reflects very recent trends and is sensitive to short-term streaks. A long window (last 200–500 draws) gives you a smoother, more statistically reliable picture but may miss recent momentum. Most experienced players work with a 100-draw window as a starting point — long enough to be meaningful but recent enough to reflect current patterns across each operator's draw history.
Step 2 — Identify Hot Numbers as Your Base List
Open the 4D Statistics page and filter for your chosen operator and time window. Sort by frequency to find the numbers that have appeared most often. These are your hot numbers. Write down or note the top 10 to 20 results — this becomes your base candidate list before you apply further filters.
Hot numbers are not guaranteed to keep appearing, but they represent numbers that have demonstrated consistent activity within your selected period. They are a reasonable starting point because they have already shown up in the prize pool recently, which means the draw data has validated them at least within your window of analysis.
Step 3 — Cross-Check Against Overdue Data
From your hot numbers base list, check which of those numbers are also currently overdue — meaning the gap since their last appearance is longer than their own historical average interval. A number that is both a hot number overall and currently overdue is a particularly common target for experienced players because it satisfies two criteria simultaneously:
- Long-term frequency — it has appeared often enough to be considered active within your analysis window.
- Current gap — it has not appeared recently, suggesting it may be due to return based on its own historical rhythm and appearance pattern.
Not every hot number will also be overdue, and that is fine. The overlap between the two groups tends to be a smaller, more focused shortlist that you can realistically bet on without spreading your budget too thinly across too many entries.
Step 4 — Apply Digit-Level Frequency Analysis
If your shortlist is still too large after steps 2 and 3, apply digit-level filtering as a further refinement. Instead of looking at full 4-digit combinations, look at how often individual digits (0–9) appear in each position across all winning numbers within your time window.
For example, if the digit 7 appears frequently in the first position across recent draws, numbers starting with 7 may be worth prioritising. If the digit 3 has been notably absent from the third position, you might de-prioritise numbers with 3 in that slot. This is a finer level of analysis than full-number frequency and helps you refine a broad shortlist into a tighter group of candidates with multiple overlapping signals supporting each entry.
Step 5 — Decide on Single Operator or Multi-Operator
A number that appears frequently across multiple operators — Magnum, Da Ma Cai and Sports Toto — carries more weight than one that is only hot with a single operator. If a number shows up in the top frequency rankings for two or three operators simultaneously, that cross-operator consistency suggests the number has been genuinely active rather than benefiting from a single operator's variance within a short period.
Conversely, if you only bet with one operator, focusing entirely on that operator's data is sufficient. There is no benefit to cross-referencing other operators' data if you are not placing bets with them, since each operator runs independent draws with no correlation to the others.
Step 6 — Set a Fixed Shortlist and Stick to It
Once you have applied the filters above, settle on a shortlist of 3 to 5 numbers per draw. The discipline of working from a fixed shortlist is what separates a statistical approach from random selection. Changing your numbers every draw based on whatever the latest result was is a common mistake — it prevents you from building any meaningful pattern of feedback about your own selection method.
Commit to your shortlist for a defined period — at minimum 10 draws, ideally 20 or more. At the end of that period, review which numbers came closest to landing in the prize pool and use that feedback to refine your selection process for the next cycle. This iterative approach is how a data-driven 4D strategy develops over time through consistent and structured observation.
Reminder: Statistics describe historical patterns in past draw data. They do not predict future results. Each 4D draw is an independent random event and no number is ever "due" to win in any mathematical sense. Use statistics as a structured shortlisting tool, not as a prediction model for guaranteed outcomes.
Combining Statistics With Personal Numbers
Many players use statistics to narrow their candidate pool but make the final pick based on personal significance — a birthday, an anniversary, a number seen repeatedly in daily life. This hybrid approach is completely valid. Statistics reduce an infinite candidate space of 10,000 possible numbers down to a manageable shortlist, and personal judgement makes the final call from within that shortlist in a way that keeps the experience meaningful and engaging for each individual player.
The key is using statistics as a structured filter rather than ignoring them entirely or treating them as an infallible oracle. Check the latest 4D results after every draw and track how your shortlisted numbers perform over time — that ongoing feedback loop is where the real learning about your own selection preferences and tendencies actually takes place.
← Back to Guides